Zone Anomaly
The zone anomaly function detects anomalous thermal zones based on indoor air temperature and airflow control error.
Outputs
Figures
The zone anomaly function creates a visual depicting the zone cluster/groups with respect to normal indoor air temperatures and airflow control error. This visual is generated twice, once for the heating season (December through February) and again for the cooling season (May through August). The airflow control error is the difference between the actual and setpoint airflow rate with respect to the airflow rate setpoint. A positive (+) percentage indicates a higher actual flow rate than the setpoint and a negative (-) percentage indicates a lower actual flow rate than the setpoint. Figure 1 below is an example of this visual.
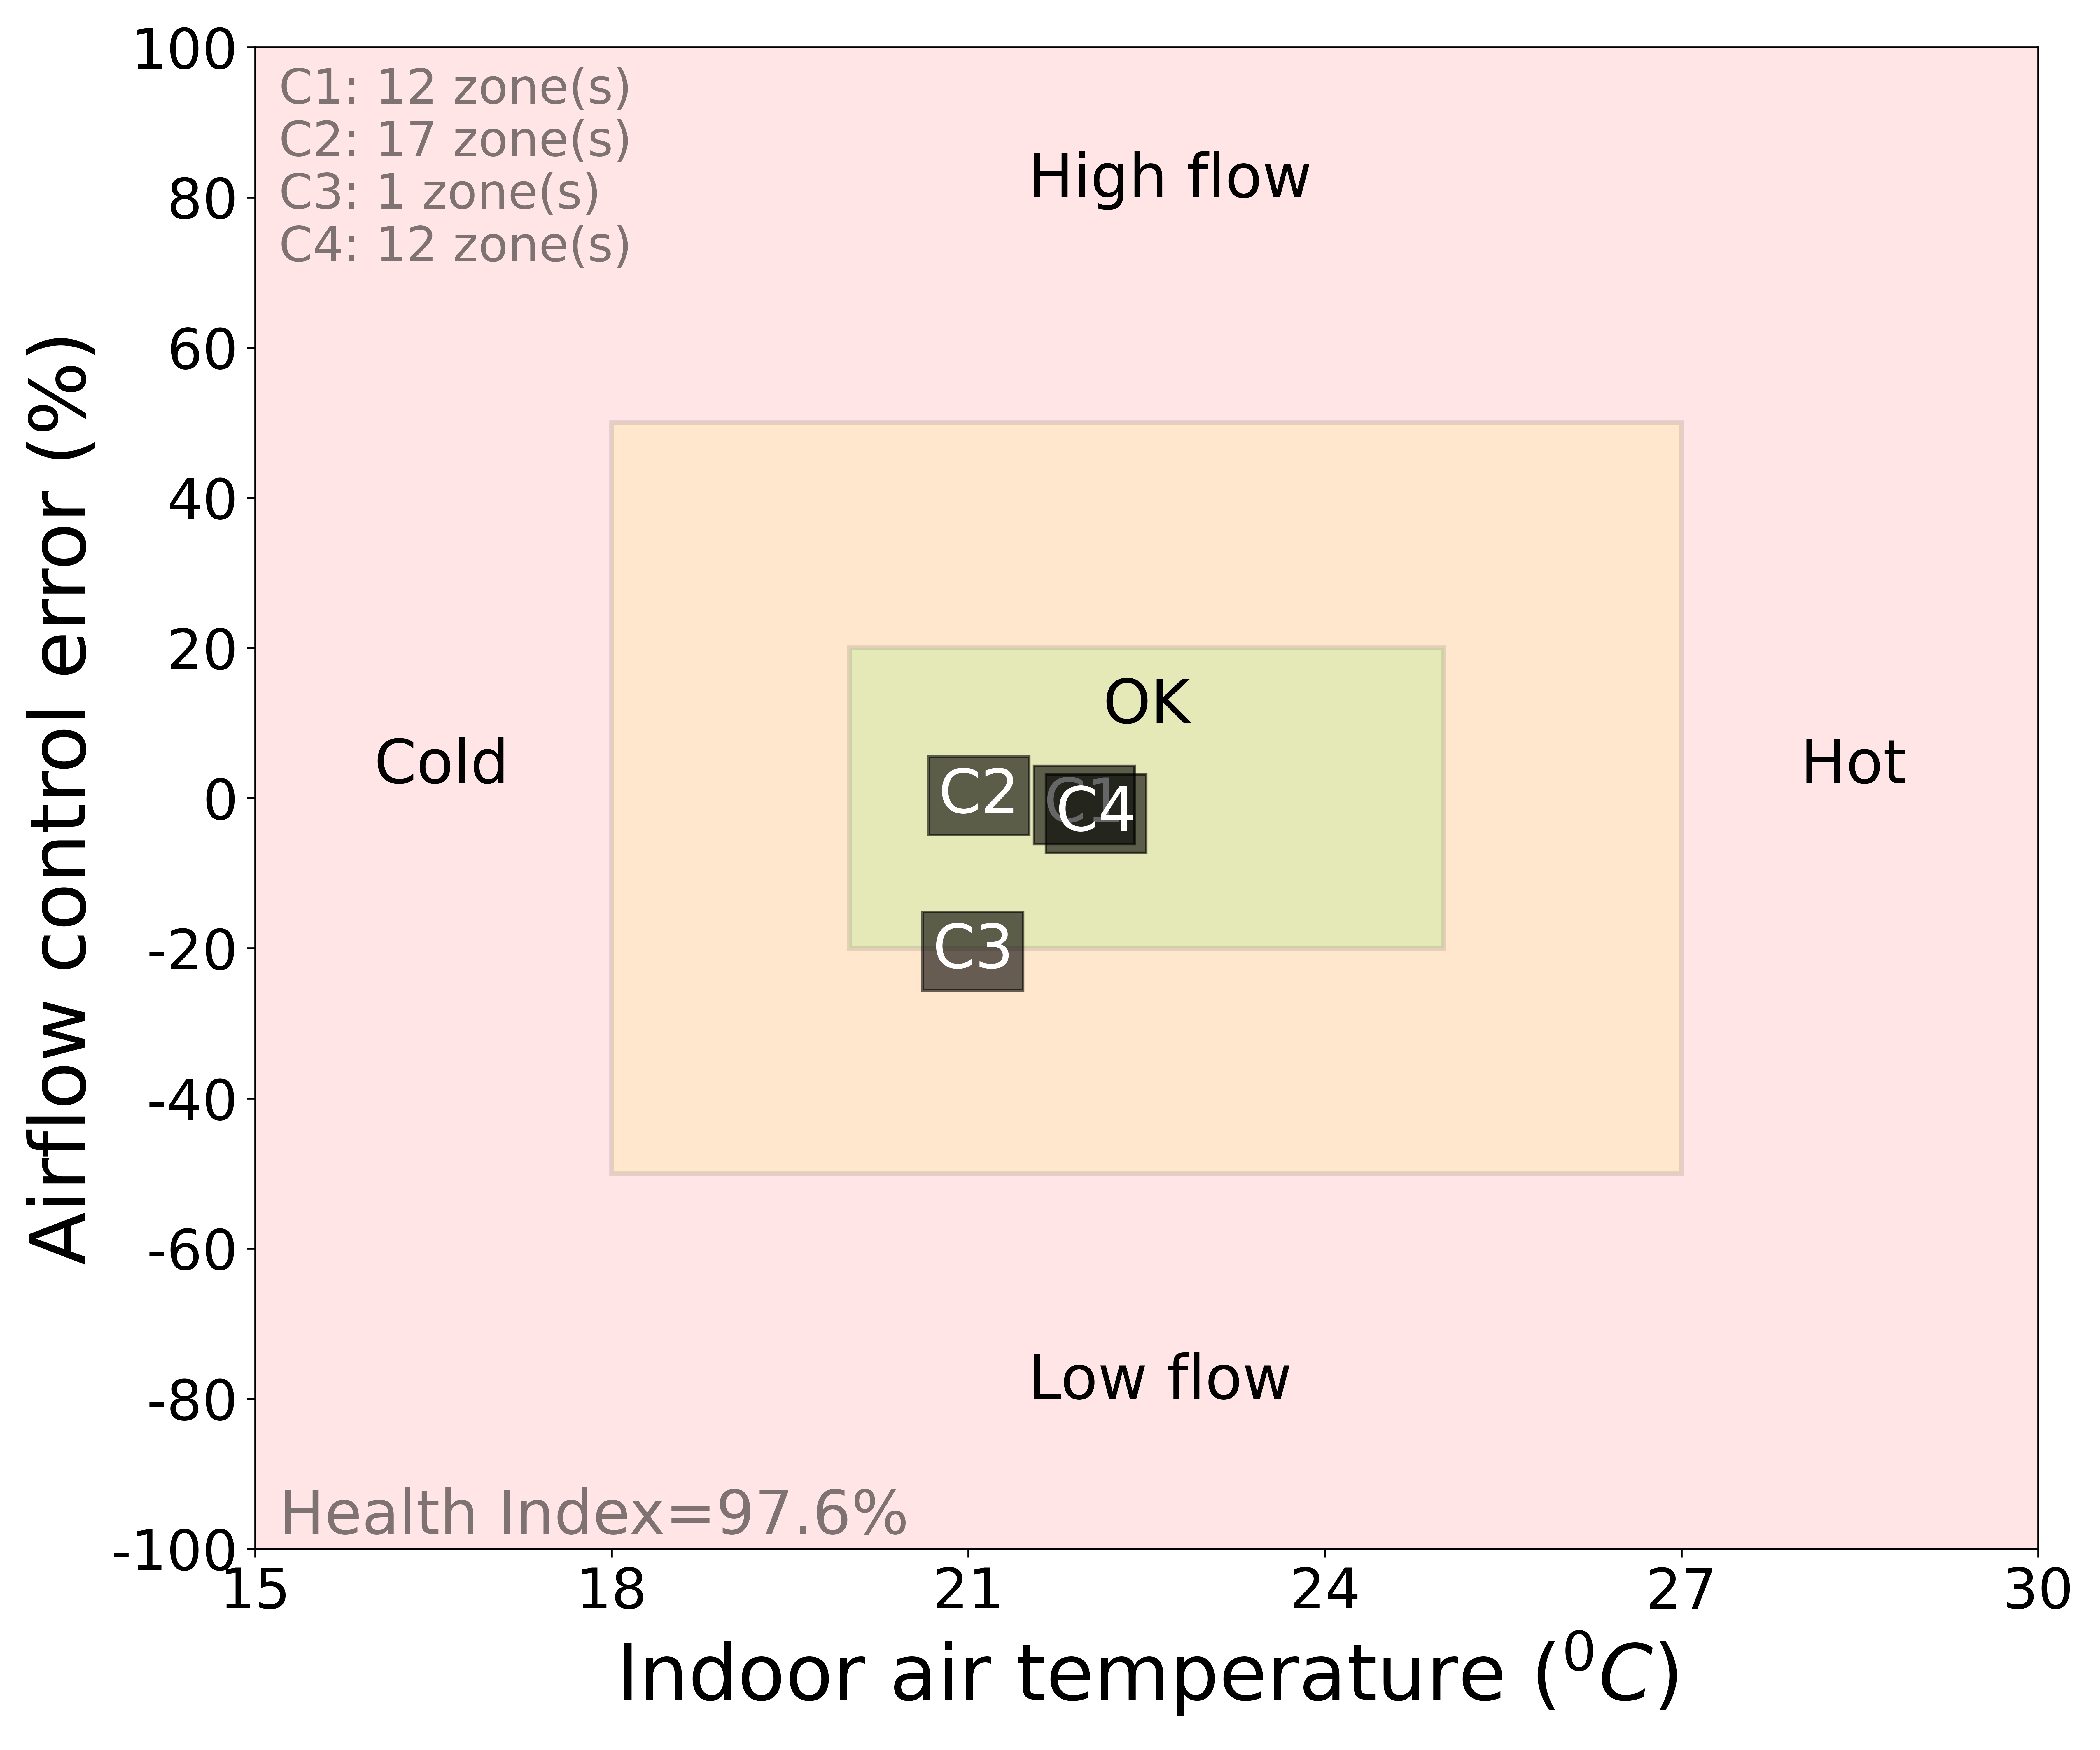
Each group of zones (C1, C2, C3, etc.) represents a number of zones which is presented at the top-left portion of the visual. Zones are grouped into clusters based on statistically similar indoor air temperature and airflow control errors. The bottom-left portion presents the zone health index which is the ratio of zones with acceptable indoor air temperature and airflow control error over the total number of identified zones.
Key Performance Indicators (KPIs)
The zone anomaly function calculates a zone health index; this is done separately for the heating and cooling seasons. The zone health index is the ratio of zones with 'healthy' indoor air temperature and airflow control error (between 20oC and 25oC and within +/- 20% airflow control error) over the total number of zones analyzed. If all zones exhibited 'healthy' conditions, the zone health index would be 100%, and if all zones fall outside the range for 'healthy' conditions, the zone health index would be 0%. Additionally, the function outputs a table detailing the results of the clustering algorithm, which includes the number of zones attributed to each zone cluster, the average zone air temperature per zone cluster, and the average airflow rate control error per zone cluster. (The average fraction of active perimeter heating devices per zone cluster is calculated for the heating season only.) Table 1 below is an example output which details the results of a clustering algorithm for the heating season, and Table 2 is an example output for the cooling season.
| Number of zones | Average zone air temperature (oC) | Average airflow control error (%) | Average fraction of active perimeter heaters (%) |
|---|---|---|---|
| 12 | 22.0 | -0.9 | 19.5 |
| 17 | 21.1 | 0.3 | 86.4 |
| 1 | 21.0 | -20.4 | 82.4 |
| 12 | 22.1 | -2.1 | 53.7 |
| Number of zones | Average zone air temperature (oC) | Average airflow control error (%) |
|---|---|---|
| 27 | 22.2 | -0.2 |
| 3 | 21.1 | 5.1 |
| 2 | 21.9 | 5.3 |
| 4 | 22.6 | 1.8 |
| 6 | 22.2 | -1.4 |