Occupancy
The occupancy function generates daily occupant count profiles and calculates typical occupant arrival and departure times.
Outputs
Figures
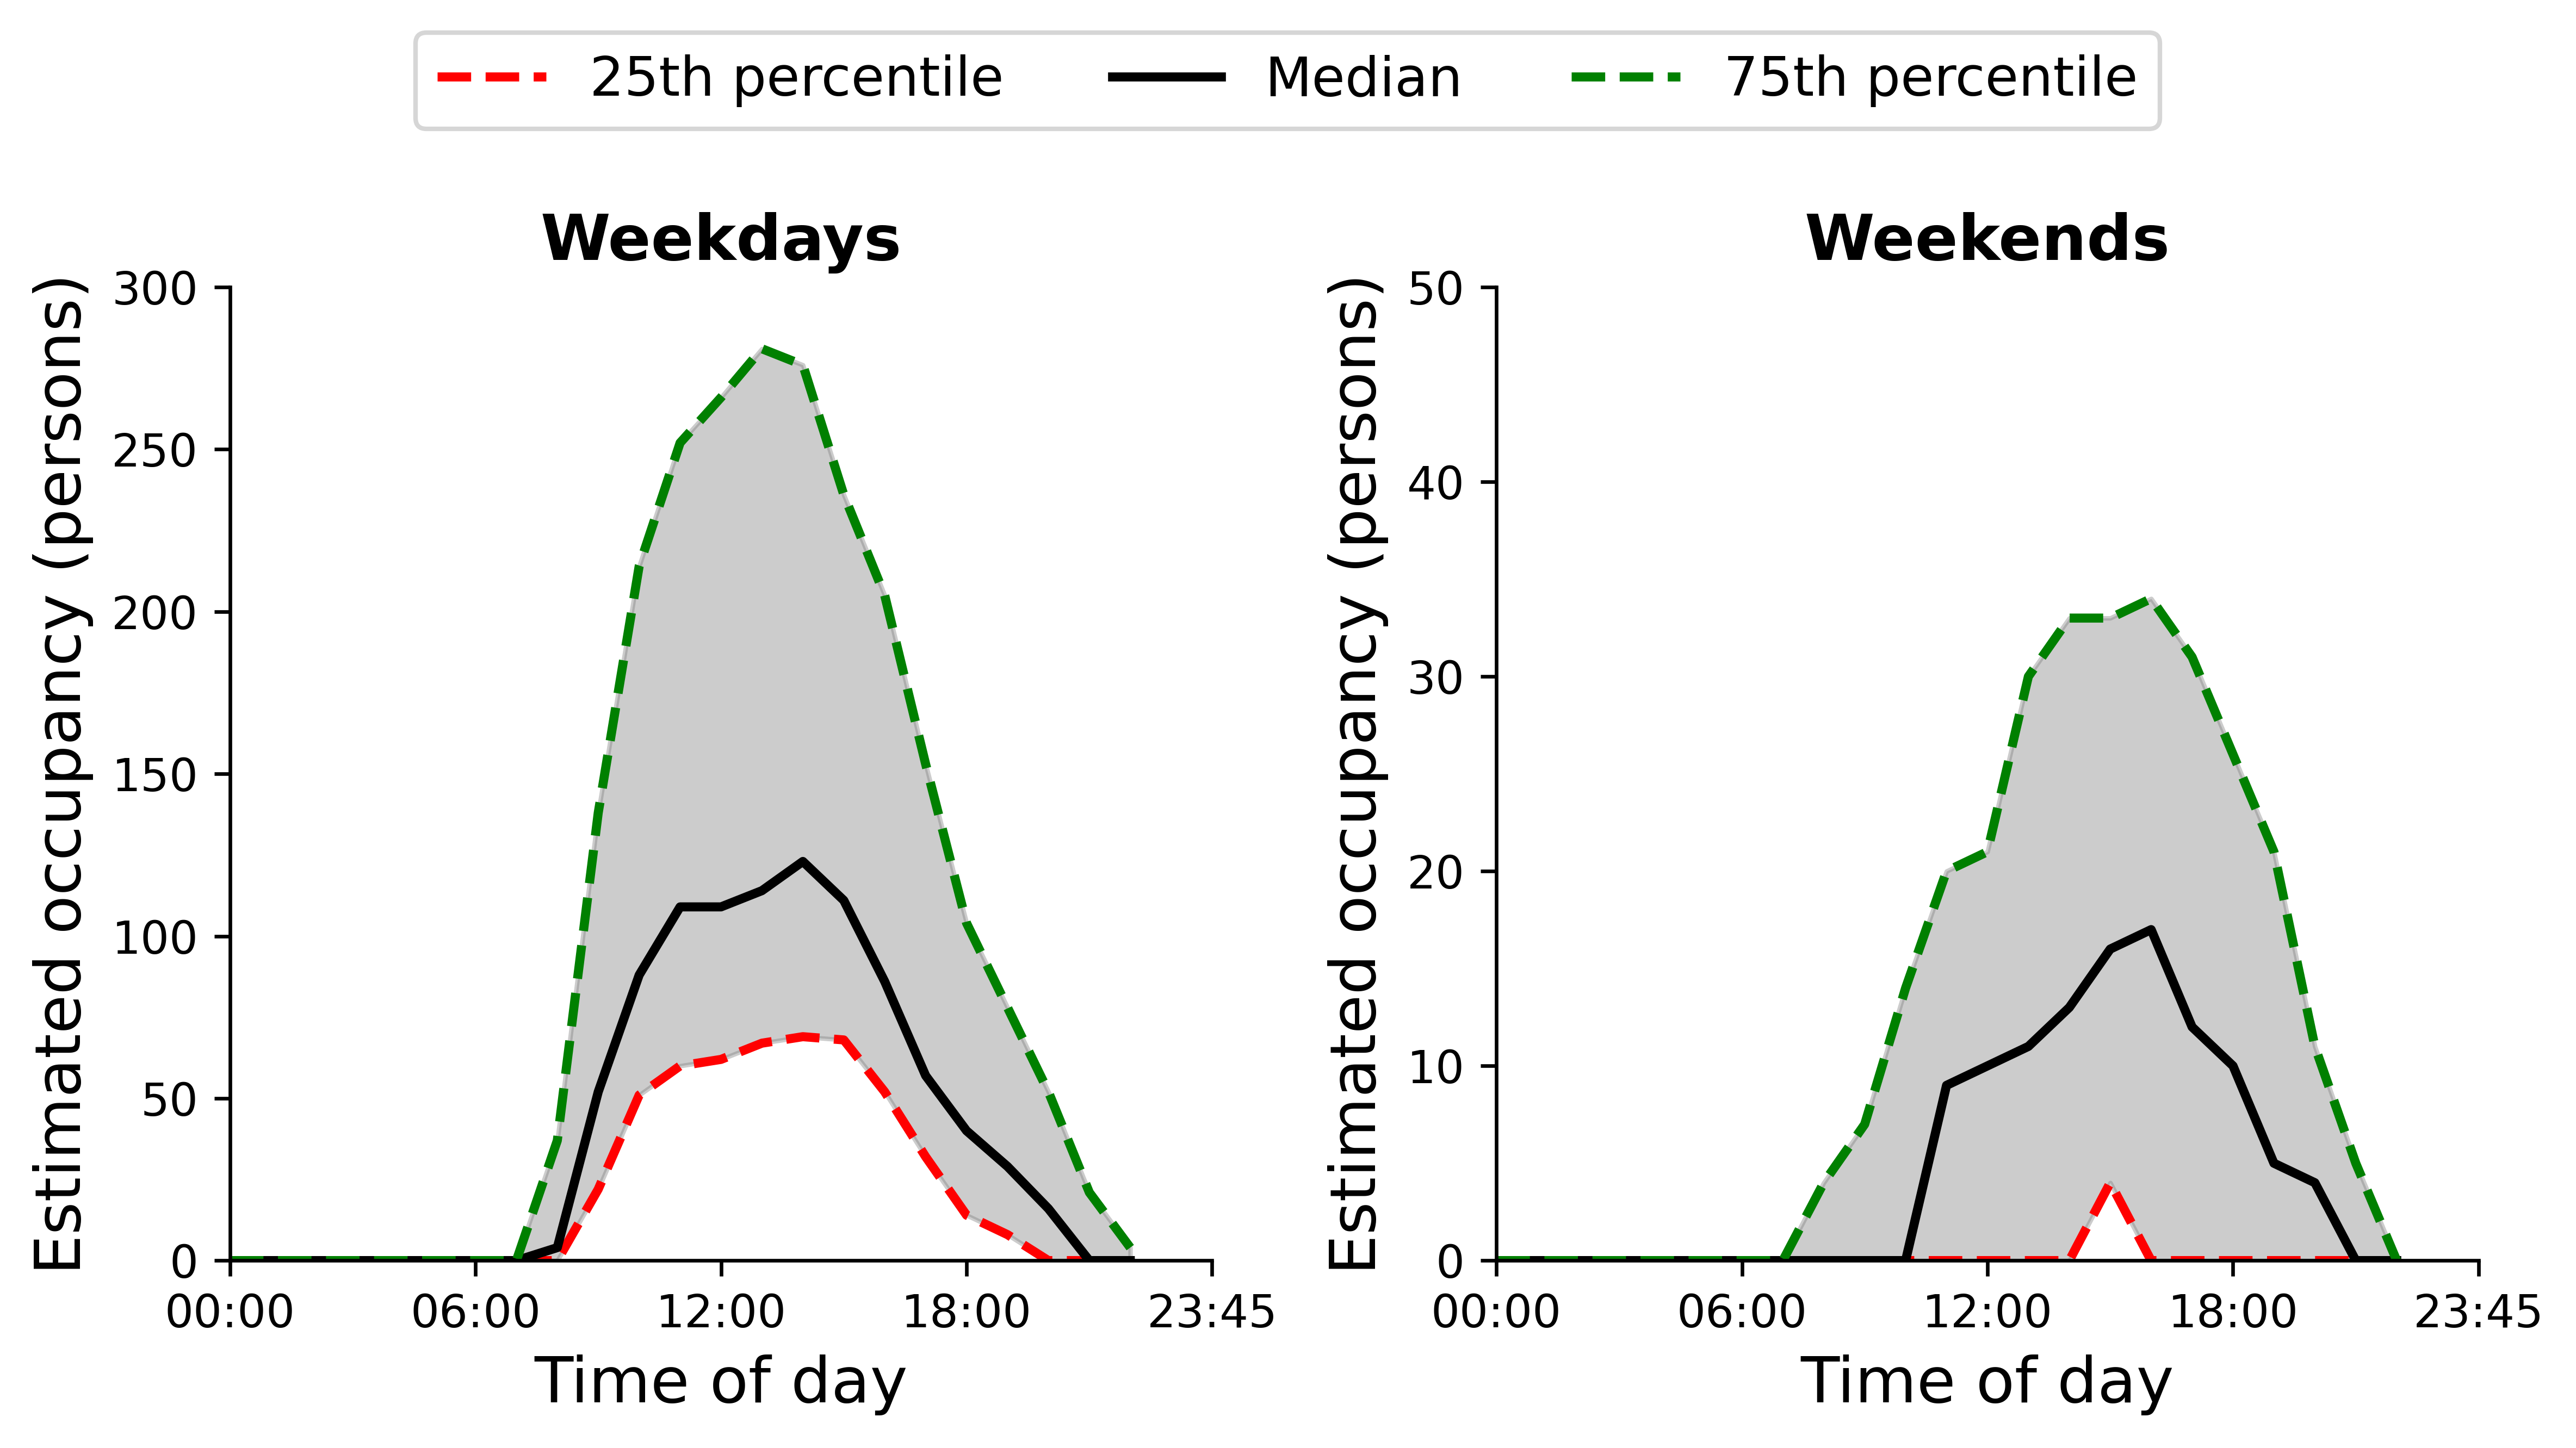
With Wi-Fi device count data, the occupancy function generates hourly occupant count profiles for weekdays and weekends separately; Figure 1 below is an example. As occupancy typically varies from day to day, a lower (25th percentile) and higher (75th percentile) occupant count is provided, as well as the median (50th percentile).
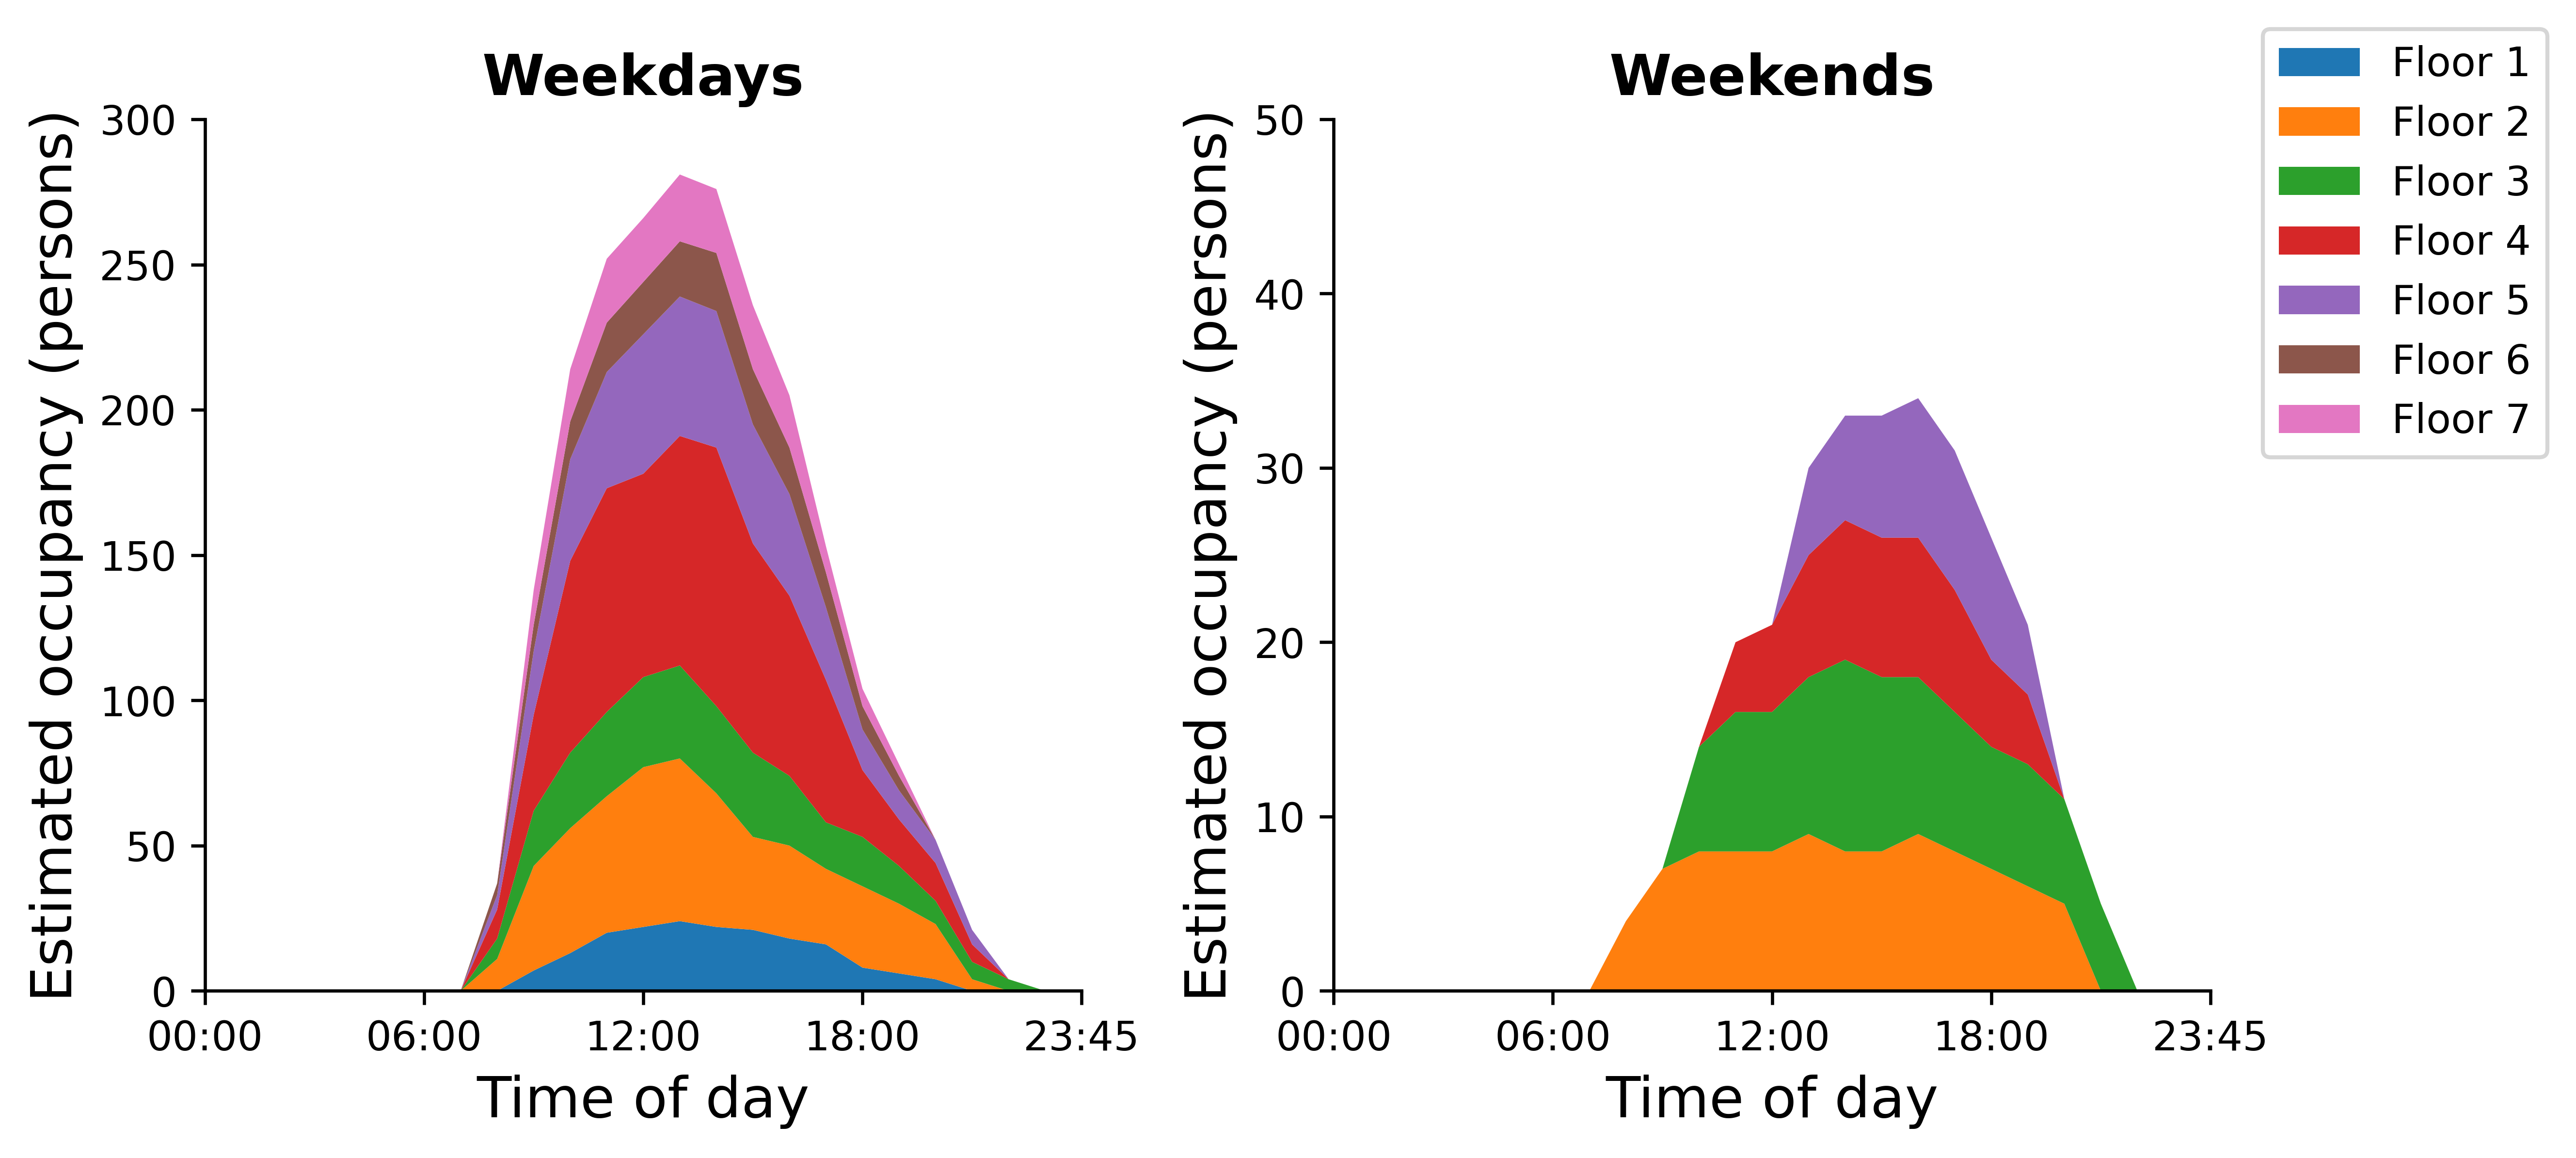
If multiple files are detected, whereby each file represents the device count data for each floor of the building, occupant count profiles separated by floor will also be provided at the higher typical range of occupancy (75th percentile); Figure 2 below is an example.
**Note that no figure is generated if the motion detection data is provided.
Key Performance Indicators (KPIs)
If provided with Wi-Fi device count data, the occupancy function will calculate typical occupant arrival times, occupant departure times, and maximum observed occupancy for weekdays and weekends separately. If multiple instances of Wi-Fi device count data are inputted, the times and maximum occupancy will be calculated separately for each floor as seen in the example outputs in Table 1 below. These KPIs are calculated using the 75th percentile, which represent the higher typical range of occupancy.
| Floor | WEEKDAY earliest arrival time | WEEKDAY latest departure time | WEEKDAY highest occupant count | WEEKEND earliest arrival time | WEEKEND latest departure time | WEEKEND highest occupant count |
|---|---|---|---|---|---|---|
| 1 | 08:00 | 19:00 | 24 | 10:00 | 16:00 | 9 |
| 2 | 07:00 | 21:00 | 56 | 0 | ||
| 3 | 07:00 | 20:00 | 48 | 09:00 | 19:00 | 11 |
If supplied with motion detection data, the occupancy function will calculate the earliest and latest arrival time, latest departure time, and longest duration of break; Table 2 is an example of the outputs.
| Earliest arrival time | Latest arrival time | Latest departure time | Longest break duration (hours) |
|---|---|---|---|
| 8:00 | 11:00 | 20:00 | 04:00 |