AHU Anomaly
The AHU anomaly function detects common hard and soft faults related to a building's air handling unit(s).
Inputs
AHU-level HVAC Control Network Trends
The AHU anomaly function requires AHU-level HVAC control network trend data. These data are a record of the various actuator and sensor measurements pertaining to the air handling units (AHUs) and can typically be extracted from a building automation system (BAS). For this analysis, seven (7) unique trend data are required for each AHU; they are as listed with units and range in Table 1 and must be formatted as in Figure 1.
| Required trend data | Abbreviation | Unit | Range |
|---|---|---|---|
| Supply/discharge air temperature | tSa | oC | - |
| Return air temperature | tRa | oC | - |
| Outdoor air temperature | tOa | oC | - |
| Outdoor air damper position | sOa | % | 0(closed) - 100(open) |
| Heating coil valve position | sHc | % | 0(closed) - 100(open) |
| Cooling coil valve position | sCc | % | 0(closed) - 100(open) |
| Supply/discharge fan operating state | sFan | % | 0(closed) - 100(open) |
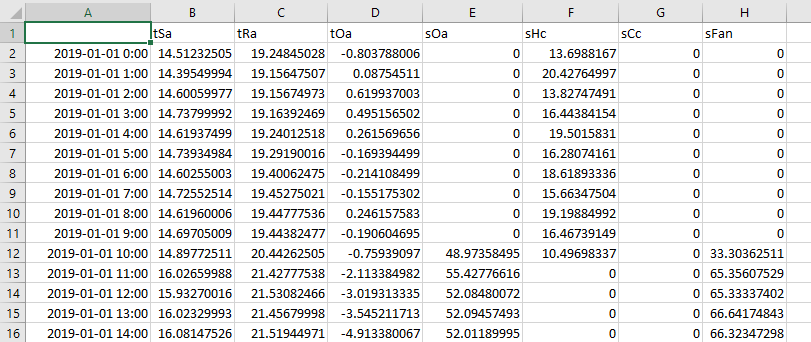
This function requires hourly trend data. The first column must contain the timestamp at which the measurement was recorded. The timestamp must include the numerical date and time and in the following format: [yyyy-mm-dd hh-mm]. Each subsequent column must contain the trend data as listed in Table 1 in descending order (i.e. second column contains supply/discharge air temperature, third column contains return air temperature, etc.)
A minimum of one (1) CSV file containing AHU-level HVAC control network trend data must be supplied to this function, where each CSV file represents a separate AHU. If multiple files are inputted, the function will conduct a separate analysis and generate a separate set of visuals and KPIs for each AHU detected. See outputs for information about generated KPIs and visuals. Note that timestamps must be consistent between multiple files.
Zone-level HVAC Control Network Trends
The AHU anomaly function also requires zone-level HVAC control network trend data. Like AHU-level HVAC control network trend data, these data are a record of various actuator and sensor measurements, but pertain to variable air volume (VAV) terminals which regulate airflow and sometimes re-condition supply/discharge air from the AHUs to specific thermal zone(s). For this analysis, four unique trend data are required for each zone/VAV; they are as listed in Table 2 and must be formatted as seen in Figure 2.
| Required trend data | Abbreviation | Unit | Range |
|---|---|---|---|
| Indoor air temperature | tIn | oC | - |
| Supply/discharge airflow | qFlo | m3/s | - |
| Supply/discharge airflow setpoint | qFloSp | m3/s | - |
| Operating state of perimeter heating device(s) | sRad | % | 0(inactive) - 100(fully active) |
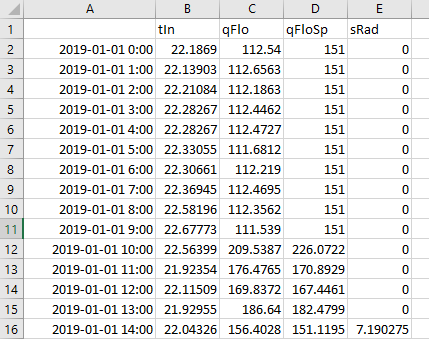
This function requires hourly trend data. Like AHU-level HVAC control network trend data, the first column must contain the timestamp, which must include the numerical date and time and in the following format: [yyyy-mm-dd hh-mm]. The timestamps must be consistent with the timestamps in the AHU-level HVAC control network trend data. Each subsequent column must contain the trend data as listed in Table 2 in descending order (i.e. second column contains indoor air temperature, third column contains supply/discharge airflow, etc.)
A minimum of one (1) CSV file containing zone-level HVAC control network trend data must be supplied to this function, where each CSV file represents a unique VAV terminal unit or thermal zone. Note that timestamps must be consistent between multiple files and with the timestamps in the AHU-level HVAC network trend data.