Energy Baseline
The energy baseline function compares energy use during and outside scheduled air handling unit operating hours, and predicts rate of energy use at varying outdoor air temperatures.
Outputs
Figures
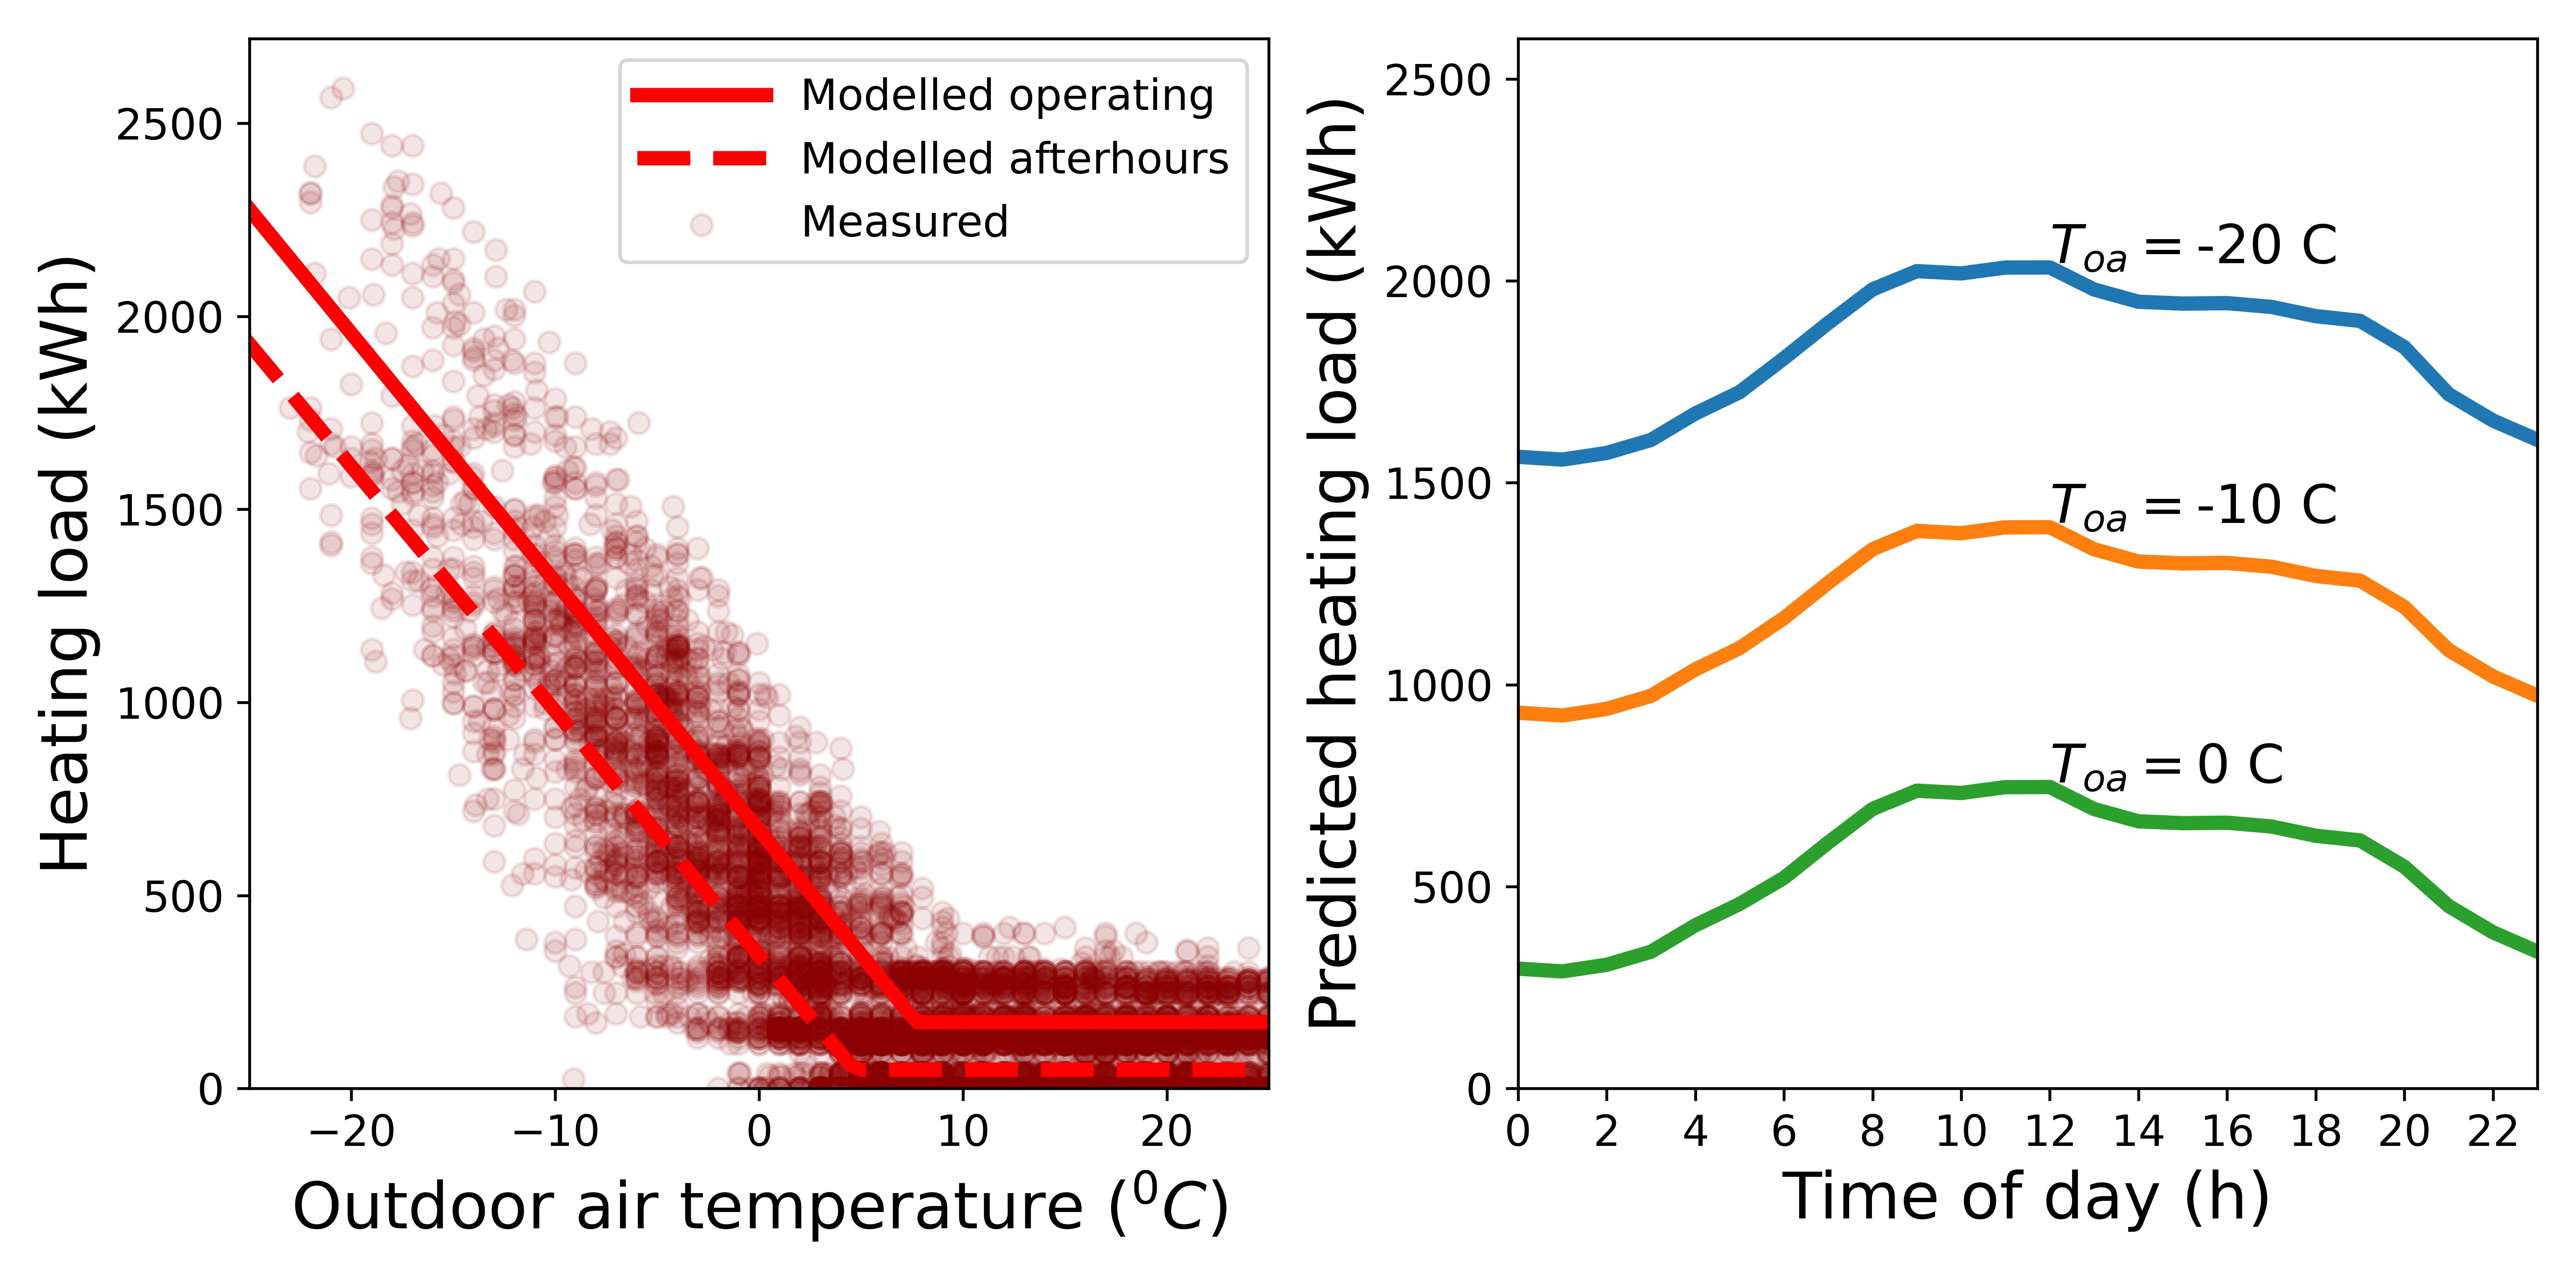
The energy baseline function generates visualizations comparing the rate of energy use during and outside scheduled operating periods; Figure 1 below is an example. It does this by generating two modified ASHRAE Guideline 14 three-parameter univariate change point models - one representing energy use during scheduled operating hours (workhours) and the other representing energy use outside scheduled operating hours (afterhours); this is done for heating, cooling, and electricity use separately. Each model is defined using three parameters – the rate of change of energy use, the change point temperature, and the energy use associated with the change point temperature, with outdoor air temperature as the regressor. These parameters and the start and stop times associated with the weekly air handling unit operating schedule are iteratively estimated using a genetic algorithm.
Key Performance Indicators (KPIs)
The energy baseline function calculates two KPIs: schedule effectiveness and after-hours energy use ratio. Schedule effectiveness quantifies the difference between the slope of the work-hours energy use line and the after-hours energy use line. Values approaching zero (0%) indicate similar or identical inclined slopes, positive (+) values indicate a steeper work-hours energy use slope than after-hours, and negative (-) values indicate a steeper after-hours energy use slope. Therefore, a greater positive value is desirable since it indicates an effective reduction in energy use rates during afterhours.
The after-hours energy use ratio is the ratio of energy use during afterhours over the total energy use. A higher value indicates a larger portion of total energy consumption used during afterhours. Therefore, a lower value is desirable.
These two KPIs are calculated separately for heating, cooling, and electricity use. An example output is provided in Table 1 below. For this example, heating energy exhibited a schedule effectiveness of 50%, indicating that the work-hours energy use slope is steeper than the after-hours energy use slope - this suggests an ideal reduction in heating energy use during afterhours. cooling energy exhibited a scheudle effectiveness of 0%, indicating that the slope of work-hours and after-hours energy use are identical - this suggests an after-hours cooling energy use similar to work-hours use which is not ideal. At its poorest, electricity use exhibited a scheudle effectiveness of -20%, indicating a steeper after-hours energy use slope than the work-hour energy use slope - this may suggest that after-hours electricity use may be greater than work-hours electricity use.
| Utility | Schedule effectiveness | After-hours energy use ratio |
|---|---|---|
| Heating | 50% | 13% |
| Cooling | 0% | 50% |
| Electricity | -20% | 73% |