Resources
General guidance and sample data to help you get started.
Help
Using the toolkit
The FRAMeWORK toolkit is completely data-driven. This means that all you need to do to run the functions is supply process-history data. Once you upload your data to the selected function, the function will automatically analyze your data and generate your results in the form of multiple types of visualizations and key performance indicators (KPI); these outputs will be preformatted in a report-style document. That's it!
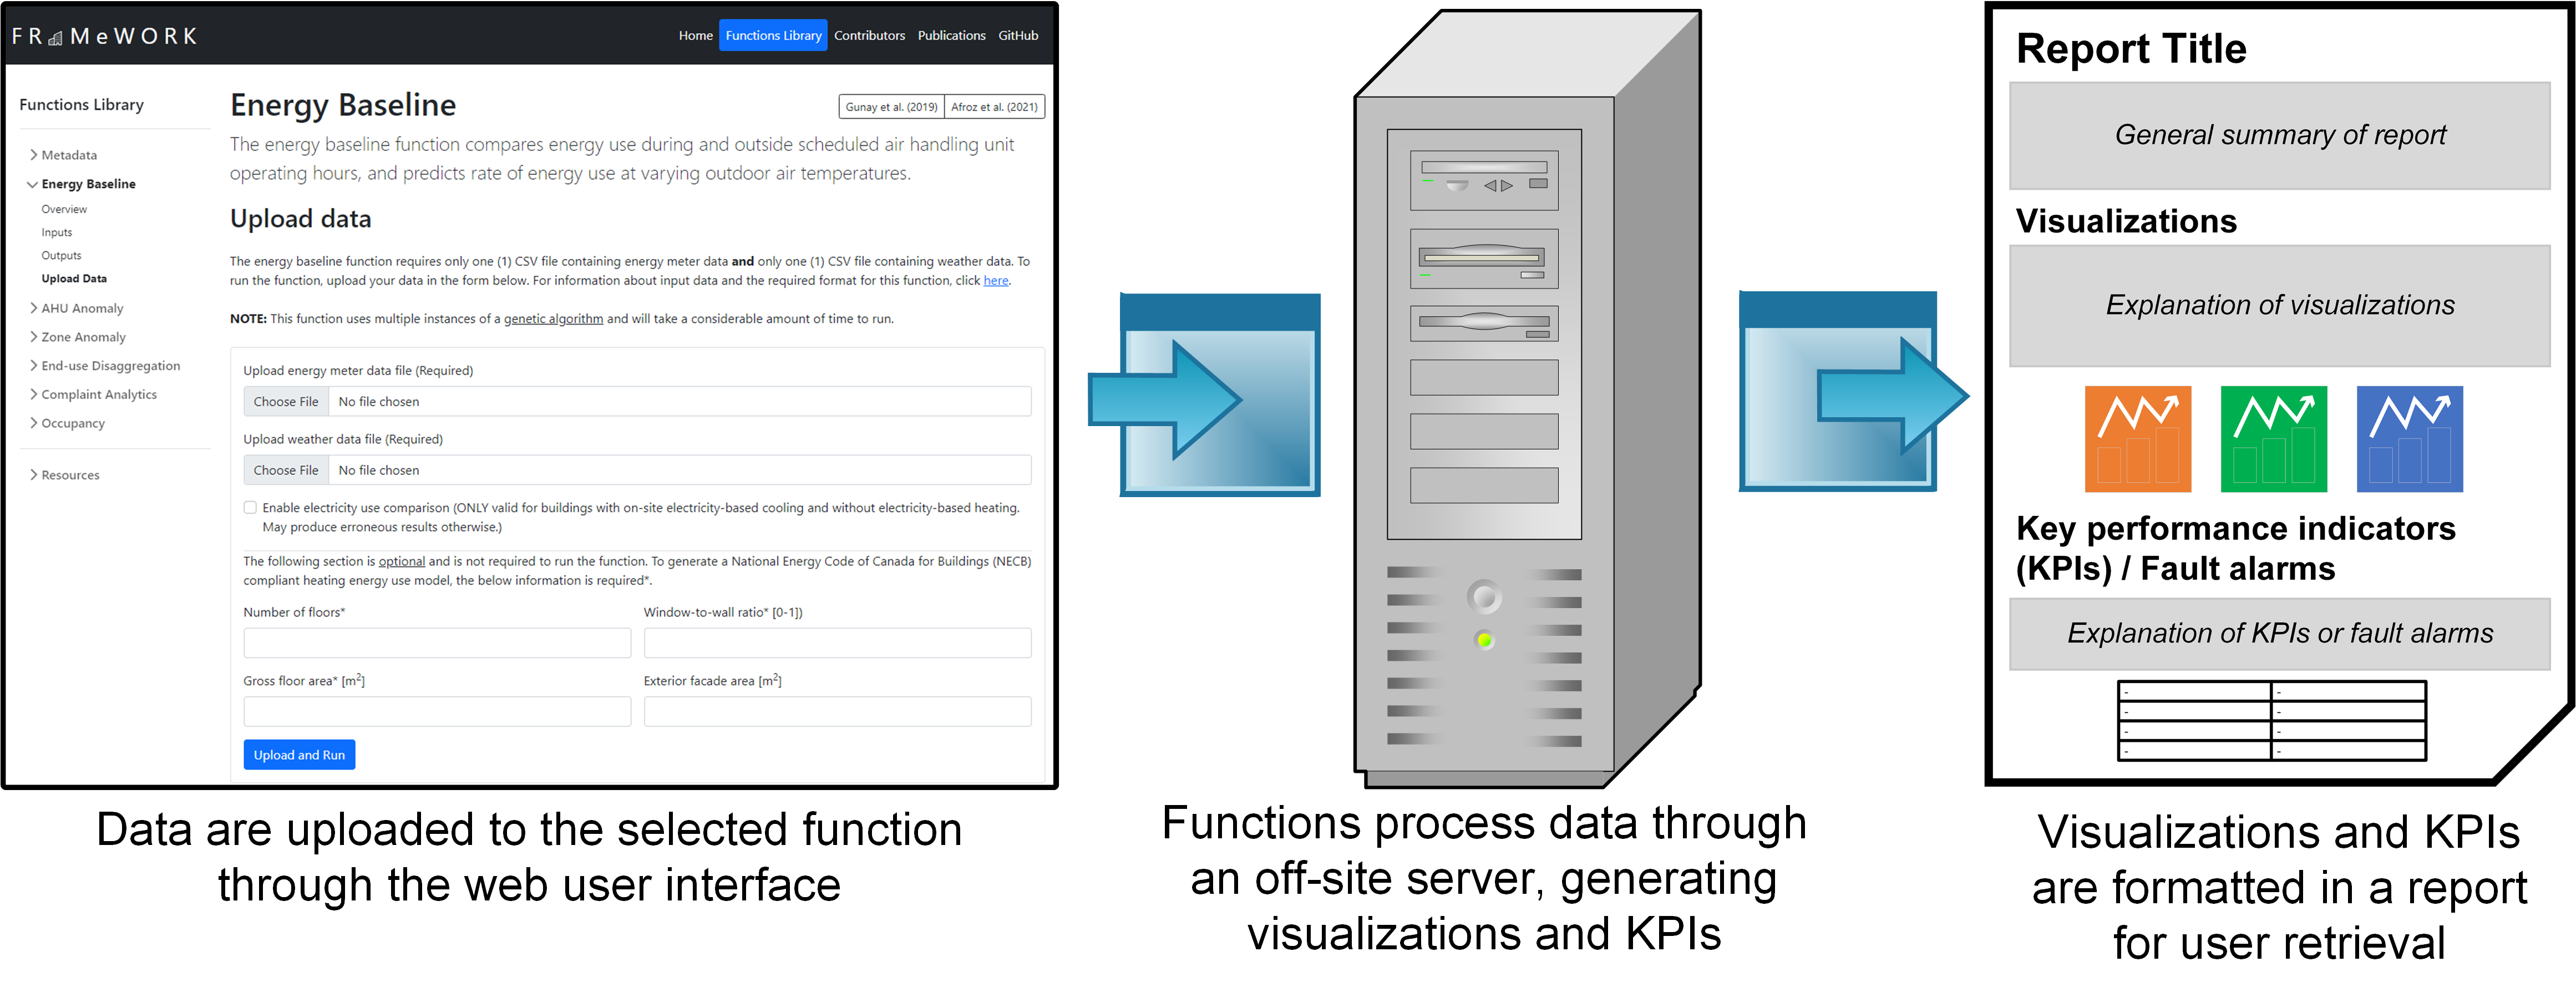
Preparing and uploading data
The toolkit is comprised of seven discrete data-driven functions. Every functions serves a unique purpose in identifying operational deficiencies and thereof, requires different sets of data and generates unique sets of visualizations and key performance indicators (KPIs). To assist the user in invoking the functions, every function in the toolbar (left of the page) contains four sections - Overview, Input, Output, and Upload Data.
Once you've uploaded your data, you're half-way done! The function you've selected will automatically analyze your data and output the results once it has finished its analysis. The analysis may take some time, depending on the amount of data you inputted and the the function you selected. Functions that utilize a genetic algorithm (i.e., AHU anomaly detection, baseline energy performance, end-use disaggregation) will take a much longer time than other functions. Please be patient!
Retreiving results
Your results can be retrieved through a randomly generated link that is provided to you upon successful data upload. Retain this link as it is the only way you will be able to get your results. When you use the link, you may be presented with one of the three following prompts.
Frequently asked questions
Though your data have been uploaded, it will take time for the function to process the data and generate your results. Ensure that you keep the link that you are provided to download and view your results and regularly check the status of the analysis.
Depending on the function you selected, and the amount of data inputted, the function can take anywhere between a few seconds to several minutes to process the data and generate results. Functions which invoke the genetic algorithm (i.e., AHU anomaly detection, baseline energy performance, end-use disaggregation) may take upwards of half an hour to process. Regularly check the status of your analysis.
Currently, the toolkit can only process one function at a time (i.e., multiple functions cannot be run simultaneously). Operating on a "first come, first serve" basis, data uploaded prior to your's are processed first before your data are processed. If the queue # is equal to one (1), your data are currently being processed.
If you are presented with "Something went wrong with the analysis," ensure the input data is formatted as prescribed by the function; the input format is outlined in each function's Input section. Also ensure that the data (excluding column headers, timestamps, and CMMS data) contains only numerical values. Non-numerical values (i.e., - , & , % , @) cannot be accepted. Be aware of any minimum data requirements that some functions impose. If you are still experiencing this problem, please contact andre.markus@carleton.ca for assistance.
Once the data have been processed, regardless if the analysis was successful or not, the uploaded data are permanently deleted. However, the generated reports are deleted periodically.